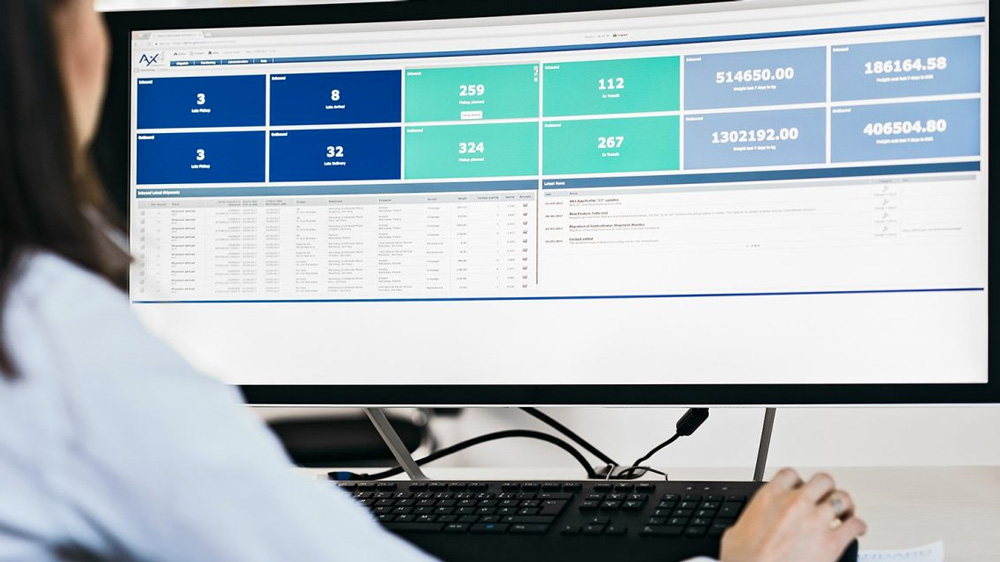
New analytics tools for AXIT’s AX4 logistics platform

Siemens subsidiary AXIT has announced that its AX4 logistics platform now features two new analytics tools to help supply chain professionals obtain faster, more powerful insights into their processes.
According to AXIT, “AX4 Cockpit” and “Analytics by Tableau” make it possible for data to be easily analyzed and visualized based on the criteria defined by the user.
“How many orders are you currently processing? How has your shipping volume evolved over time? Are your transport contractors keeping their deadlines? These new tools let logistics professionals navigate the flood of electronic data to find exactly what they need – for both operational and strategic planning,” said Christian Wendt, Head of Marketing at AXIT.
The AX4 Cockpit offers a real-time overview right in AX4 of the data and metrics you need and in a format you can customize to your unique needs and preferences, so you always have an up-to-date picture of your supply chain performance.
The partnership with data visualization provider Tableau brings a comprehensive data analytics portfolio to AXIT customers. Analytics by Tableau enables users to apply various criteria to drill down in their data, compile statistics, and present insights in a number of formats: diagrams, cluster analyses, geographic maps, etc.
“Data visualization opens up entirely new opportunities for analysis and interpretation,” saidWendt. “This reveals logical interrelationships previously hidden in tables, helping you make important decisions and better manage your logistical processes.”


